
Table of contents
You have dashboards and Power BI, data lakes and trending infrastructure, and charts that look clean in every quarterly review. So why, when a critical supplier receives an FDA warning letter or a control issue surfaces at a contract manufacturing site, are you still finding out too late?
For quality and supply chain leaders in life sciences, the challenge is knowing what all this data really means before something goes wrong.
The Gap Between Reporting and Risk Intelligence
Most quality systems were built to answer one question: What happened? Dashboards do this reasonably well. They surface trends, track deviations, and summarize audit outcomes. But pharma supply chain risk management has moved on to a harder question: What's about to happen, and where?
Answering that requires something fundamentally different from a visualization layer, which essentially is what a dashboard is. It requires a system that can ingest unstructured data from global regulatory agencies, resolve a single supplier site across the dozen names it appears under in different databases, connect internal quality signals to external postmarket data, and surface the convergence before it becomes a crisis.
That is far more complex than a dashboard. That's supply chain risk intelligence, and most dashboard infrastructure wasn’t designed to go anywhere near it.
The Excel Problem Nobody Talks About
The reality that most quality organizations don’t say out loud is that the most consequential analysis still happens in Excel. Supplier scorecards, material risk assessments, and business continuity plans all take weeks to compile, and is already outdated by the time it reaches the executive team.
No AI system can operate predictively on a foundation of static snapshots, and neither can the people relying on them. When the most critical decisions in your organization are made from spreadsheets that can't update themselves, you have a structural problem.
What Site Risk Management Actually Requires
Effective site risk management in pharma demands the right architecture to connect signals that currently live in silos. That means:
- Entity resolution: Knowing that "Hebei Yuxing Bio-Engineering Co Ltd," "Yuxing Bio Eng Co.," and "Yuxing Biotech (Hebei)" are all the same site, so a warning letter doesn't slip through because the name didn't match your spreadsheet
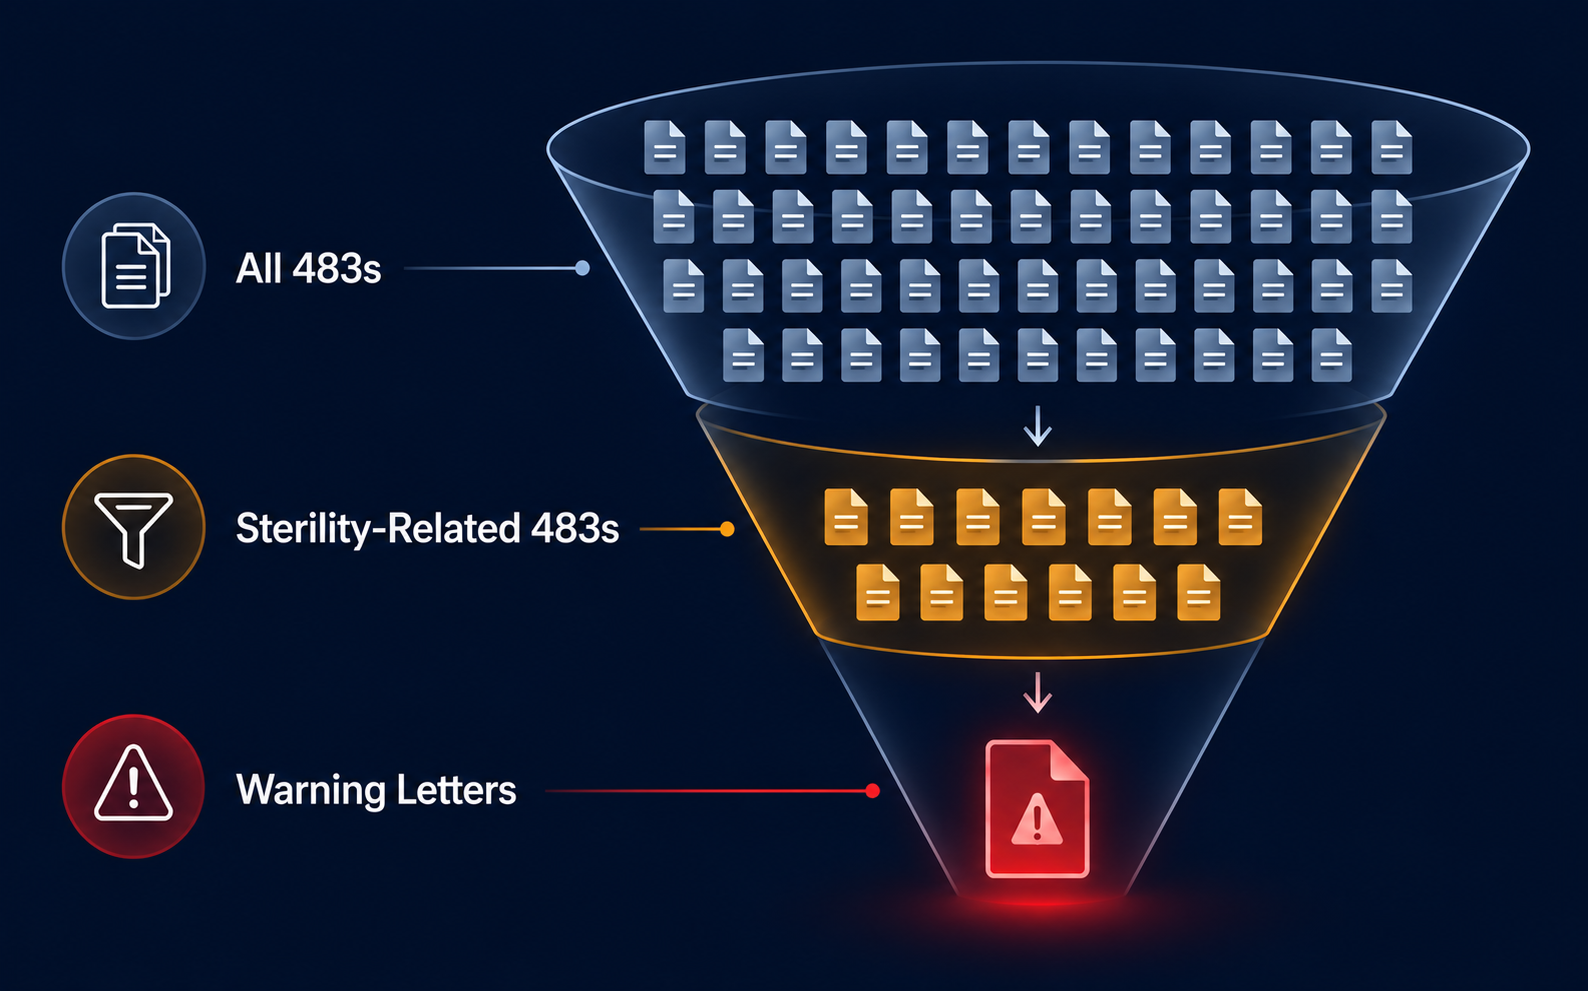
- Thematic clustering: Recognizing that two seemingly unrelated observations at two different sites are actually the same failure mode in your aseptic processing supply chain
- Signal convergence: Detecting when a declining Health Authority trend and rising adverse event severity rates at a site are pointing toward regulatory escalation, before it's announced
- Workflow execution: Not just surfacing the risk, but triggering the right action in response to that risk: audit prioritization, task creation, supplier escalation
Supply chain risk software built to report stops at the chart. An intelligence system carries the signal all the way through to a decision.
The Shift Worth Making
Quality leaders are being asked to operate predictively, manage risk continuously, and move faster than the regulatory calendar, even though their current infrastructure wasn't built for that mandate.
Download our full report, Why Dashboards Are Not Enough: The Case for a Quality Intelligence System, to dive deeper into how an intelligence system differs from a dashboard across six critical dimensions, and what exactly that means for your inspection readiness and supplier risk posture.